manual:mem
Most Monitor objects are monitoring a continuous quantity in time. Such time series are generally written to file in a columnar format, where the first column describes the point in time of recording and the following column catch the value to be monitored. Some monitors such as PatternMonitor monitor can create multiple columns corresponding to multiple time series.
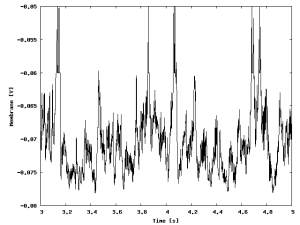
The typical output of a VoltageMonitor looks the following as a file
0.001700 -0.067260
0.001800 -0.067075
0.001900 -0.066905
0.002000 -0.066750
0.002100 -0.066608
0.002200 -0.066479
0.002300 -0.066361
0.002400 -0.066255
You can look at files of this type directly using your favourite plotter. I like gnuplot which transforms the above time series in a plot like the following

manual/mem.txt · Last modified: 2014/01/13 12:23 by zenke
